治疗的控制是肿瘤介入术中成像的重要角色。要控制一个治疗,成像系统必须能够监测术中的过程,然而,如刚才所描述的。简单地监测过程并不一定意味着治疗可以控制。在热消融的情况下,控制的消融可以来自给电极重新定位的能力或改进它的效果。术中控制的一个很好的例子是术中血管造影引导肝栓塞的应用,重复造影剂注射可以帮助确定- 需要进一步栓塞的残余滋养血管。 影像学定期评估其治疗的有效性,并确定并发症的存在或不利结果。然而,后续的图像的解释往往是难以区分消融引起的预期的变化,例如,与肿瘤生长相关的变化的解释可以是具有挑战性的。因此,消融后短期获得一个新的基线成像研究可能是有帮助的,以便和消融后期的成像研究进行比较。无论是治疗前计划的影像方式如何,最好是使用相同的影像方式以便在后续允许直接比较。 肿瘤的介入后两种常用的影像学特征用以以确定残余的肿瘤(1)组织增强和(2)的时间系列相关的图像发现结节性生长。这些都需要对术前和术后影像学结果仔细分析比较才能得出有意义的结论。介入手术后不久,一个新的基线成像的表现用来进行比较是至关重要的,由于介入治疗往往导致周围组织的实质性变化。由于残留或复发的肿瘤发现取决于观察到增强肿瘤或生长变化,数字减影成像技术即在平扫图像电子减去增强图像可能是特别有用的。例如,聚焦超声消融乳腺癌后减影技术已应用于磁共振成像【125】。然而,尽管谨慎的影像解释,减影技术都有其局限性;一项研究表明当肝移植为标准治疗时,评价影像引导下肝癌完整性CT的阳性预测值只有69%【126】。
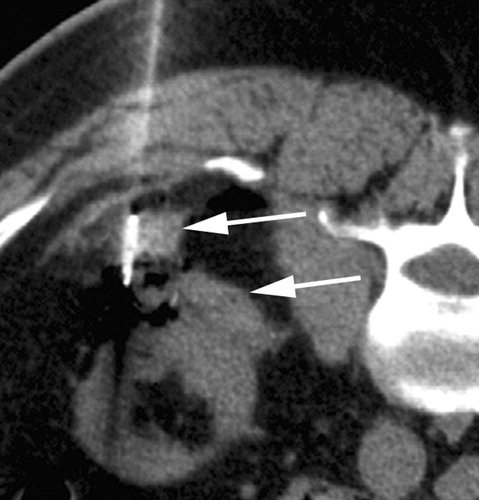
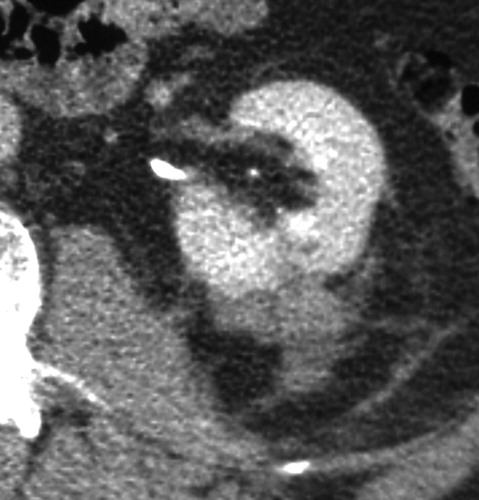
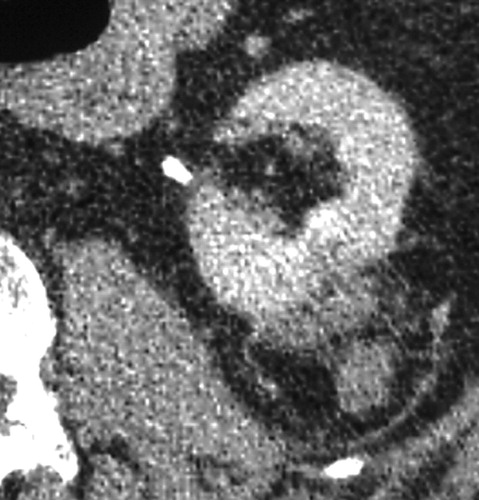
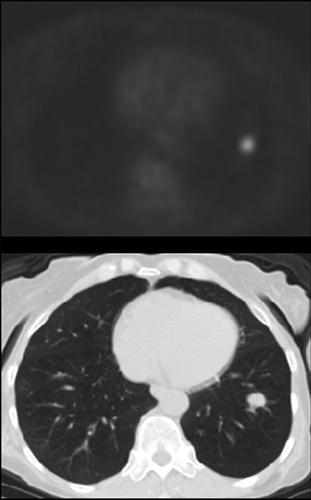
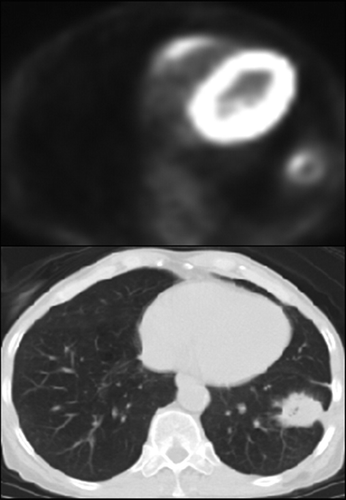
与成功消融治疗有关的MR和CT的影像学发现已经为经典。成功的消融后,大部分的消融区,包括被治疗的肿瘤称为非增强组织。打算消融区的范围是要大于原肿瘤的边界5~10mm,被称为安全边界。影像学通常表现围绕消融区周围有一个很薄的增和炎症相关强圈。这种炎症边缘的存在影像学检查如CT增强,对比增强磁共振成像,甚至FDG-PET(图11)的结果,而且很难解释;然而,炎症的边缘薄和其均匀性通常可以区别来自于一个残余癌灶较粗大或结节状增强模式【127】。
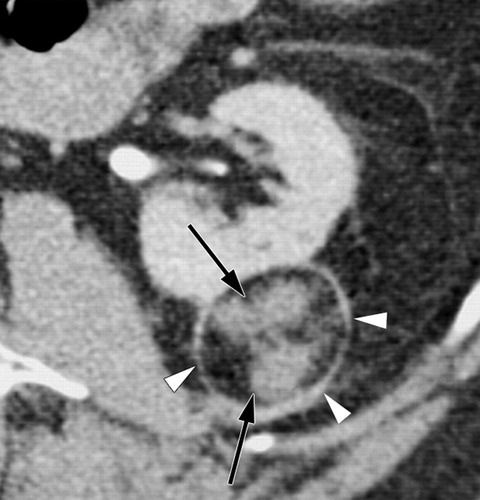
与消融后的基线影像比较随着时间的推移,消融区逐渐减小。炎症的迹象通常是消退【128,129】。复发或残留肿瘤一般表现为增强结节。然而,在有些情况下,结节状增强可能是炎症而不是肿瘤残留【130】,有报道称,在某些情况下,非增强区域的消融区可能仍有存活的癌细胞【131】。这些发现强调了需要继续研究以改进的方法确定残留或复发性疾病。
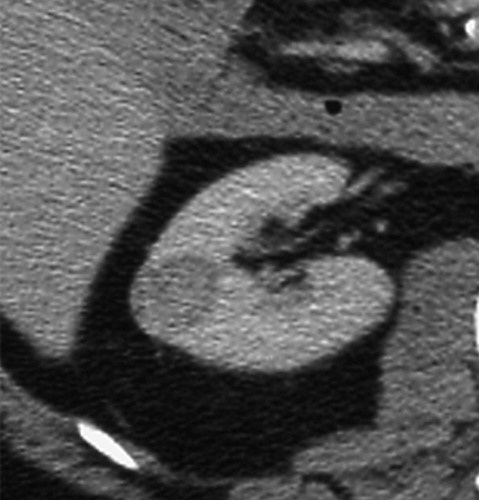
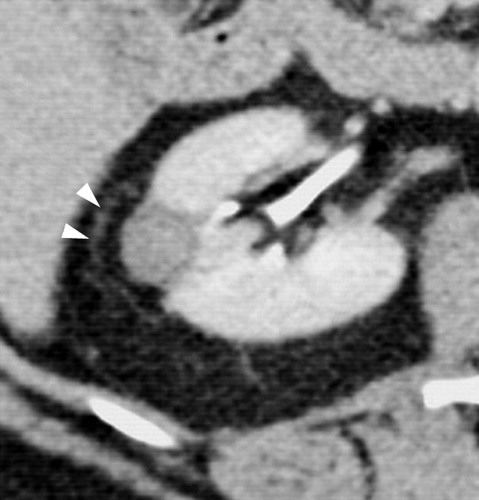
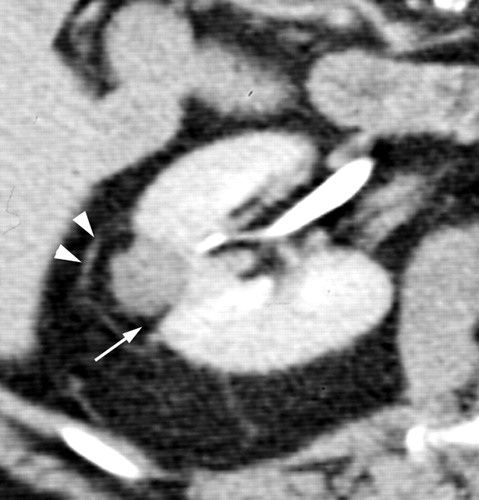
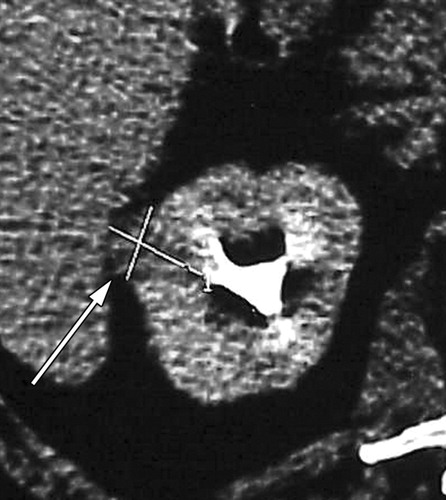
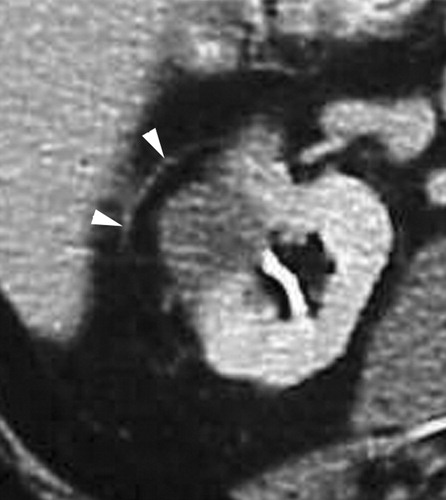
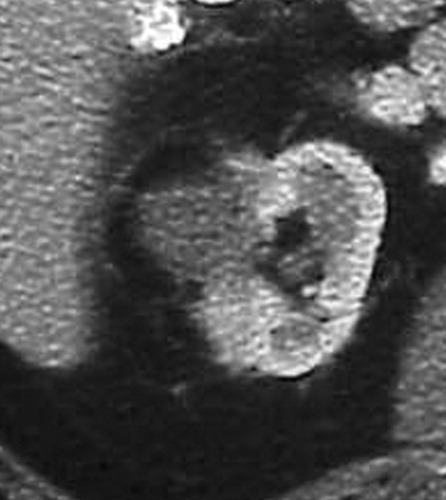
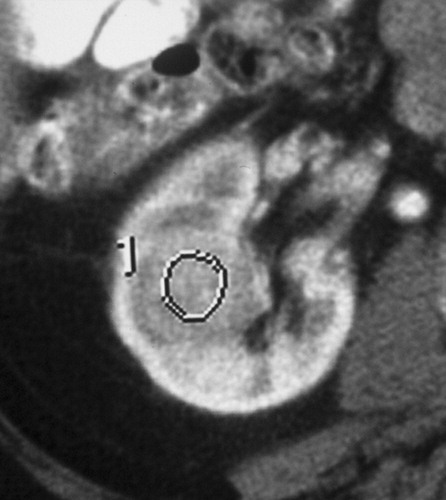
Clear cell type RCC with no evidence of residual or recurrent RCC seen after RF ablation
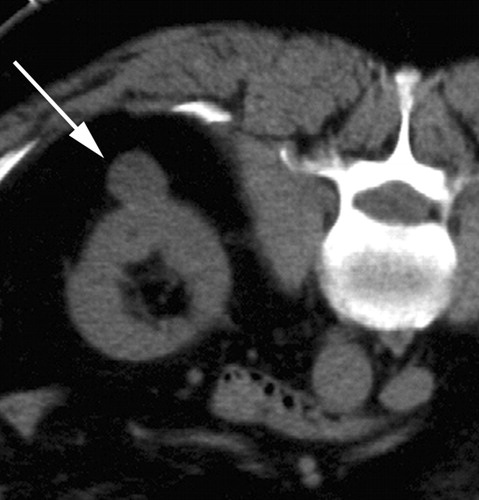
Exophytic mass in the left kidney. The mass was solid at CT and US; however, biopsy performed at the time of RF ablation was nondiagnostic. No evidence of residual or recurrent tumor was seen after RF ablation.
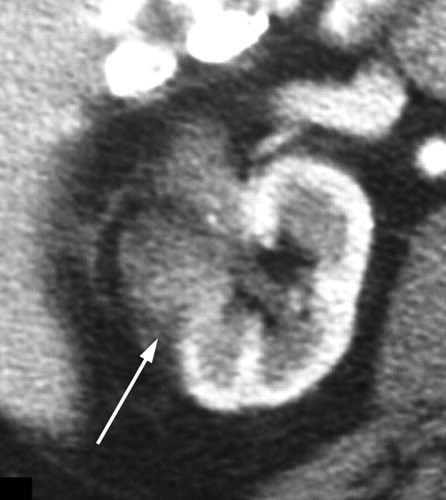
Recurrence of clear cell type RCC after RF ablation.
Postprocedural therapy assessment. PET/CT images in 64-year-old patient with inoperable non–small cell lung cancer
125. Kim SH, Jung SE, Kim HL, Hahn ST, Park GS, Park WC. The potential role of dynamic MRI in assessing the effectiveness of high-intensity focused ultrasound ablation of breast cancer. Int J Hyperthermia 2010; 26:594–603.
126. Kim YS, Rhim H, Lim HK, et al.. Completeness of treatment in hepatocellular carcinomas treated with image-guided tumor therapies: evaluation of positive predictive value of contrast-enhanced CT with histopathologic correlation in the explanted liver specimen. J Comput Assist Tomogr 2006;30(4):578–582.
127. Javadi S, Ahrar JU, Ninan E, Gupta S, Matin SF, Ahrar K. Characterization of contrast enhancement in the ablation zone immediately after radiofrequency ablation of renal tumors. J Vasc Interv Radiol 2010;21(5):690–695.
128. Park MH, Rhim H, Kim YS, Choi D, Lim HK, Lee WJ. Spectrum of CT findings after radiofrequency ablation of hepatic tumors. RadioGraphics 2008;28(2):379–390; discussion 390–392.
129. Kawamoto S, Permpongkosol S, Bluemke DA, Fishman EK, Solomon SB. Sequential changes after radiofrequency ablation and cryoablation of renal neoplasms: role of CT and MR imaging. RadioGraphics 2007;27(2):343–355.
130. Lokken RP, Gervais DA, Arellano RS, et al.. Inflammatory nodules mimic applicator track seeding after percutaneous ablation of renal tumors. AJR Am J Roentgenol 2007;189(4):845–848.
131. Weight CJ, Kaouk JH, Hegarty NJ, et al.. Correlation of radiographic imaging and histopathology following cryoablation and radio frequency ablation for renal tumors. J Urol 2008;179(4):1277–1281; discussion 1281–1283.
|


